
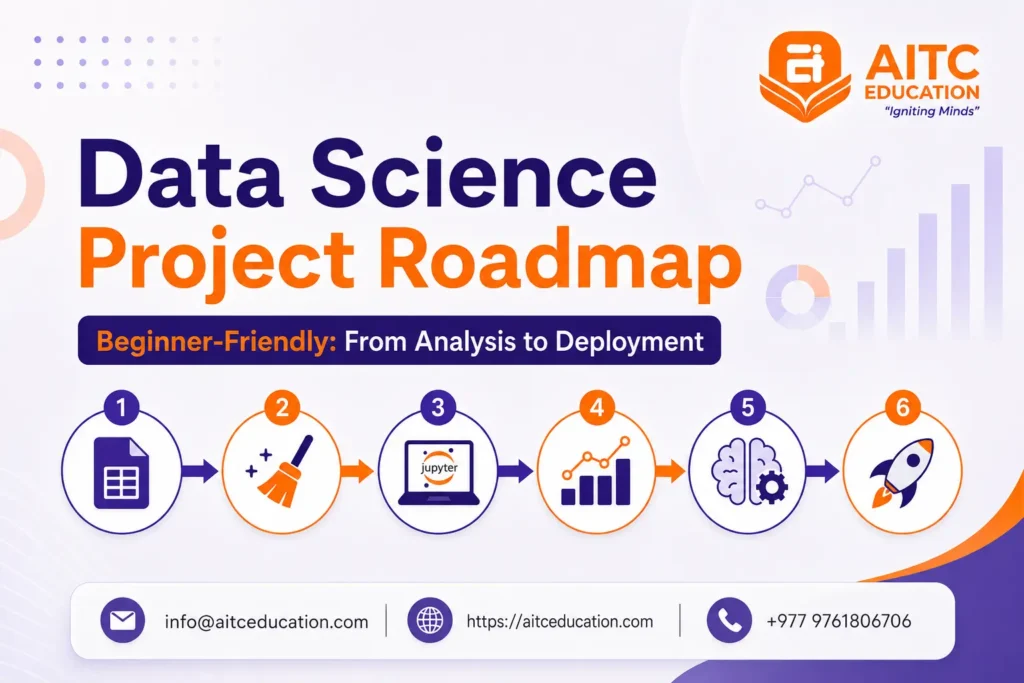
Data science projects for beginners are one of the best ways to build practical skills, strengthen your portfolio, and prepare for your first role in data science. However, many beginner project lists quickly jump into advanced topics such as deep learning, chatbots, or complex machine learning models that can feel overwhelming if you’re just getting started.
This guide takes a different approach, choosing projects to help you learn a core skill, build practical experience, and create something you can add to your portfolio. You’ll find projects that use free datasets, beginner-friendly tools, and practical tasks that can be completed within a reasonable timeframe.
Quick Reference Project List
Whether you’re looking to practice Python, learn machine learning, or build your first portfolio, the projects below provide a structured starting point. Each project focuses on one key concept, uses free tools and datasets, and can be completed without advanced programming or mathematics.
Project | Prerequisite | Tools | Estimated Time |
Exploratory Data Analysis (EDA) | Basic Python | Python, Pandas, Jupyter Notebook | 2-4 hours |
Data Cleaning & Analysis | Basic Python | Python, Pandas | 3-5 hours |
Data Visualization & Storytelling | Basic Python | Matplotlib, Seaborn | 3-5 hours |
House Price Prediction (Linear Regression) | Python basics, basic statistics | Pandas, Scikit-learn | 5-8 hours |
Titanic Survival Prediction | Python basics | Scikit-learn, Pandas | 5-8 hours |
Customer Segmentation | Python basics | Pandas, Scikit-learn | 6-8 hours |
Sentiment Analysis | Python basics | NLTK or TextBlob, Pandas | 6-10 hours |
Time-Series Sales Forecasting | Python basics | Pandas, Matplotlib | 6-10 hours |
Interactive | Basic Python | Streamlit, Pandas | 5-7 hours |
Deploying a Project with Streamlit | Completed project | Streamlit, GitHub | 4-6 hours |
What Makes a Project Right for a Beginner
Not every project labeled beginner-friendly is actually suitable for someone who is just starting out. Many online lists include advanced topics such as deep learning, image classification, or chatbot development, which require knowledge beyond the fundamentals. The data science project ideas in this guide were selected because they help you build practical skills step by step without becoming overwhelming.
Uses a Free, Ready-to-Use Dataset
A good first project should use datasets that are easy to access and well-documented. Platforms such as Kaggle, the UCI Machine Learning Repository, and Our World in Data provide free datasets that allow you to focus on learning rather than collecting or preparing complex data.
Teaches One Core Skill at a Time
Each project should focus on a single concept, whether that’s data cleaning, visualization, regression, or clustering. Learning one skill thoroughly before moving on to the next helps you build a stronger foundation and makes it easier to understand more advanced topics later.
Has a Clear, Real-World Question
The best projects solve a practical problem rather than simply demonstrating code. For example, predicting house prices, analyzing customer reviews, or identifying customer segments mirrors the types of business problems data scientists solve in real workplaces.
Can Be Finished in a Few Sittings
Projects that take several weeks to complete can be discouraging. A good first project should be achievable within a few study sessions, allowing you to maintain momentum while steadily building your confidence.
Produces Something You Can Show Employers
A good project should result in something you can include in your portfolio, such as a Jupyter Notebook, a visualization dashboard, or a deployed Streamlit application. These completed projects demonstrate your practical skills and give employers evidence that you can work with real data, not just follow tutorials.
10 Data Science Projects for Beginner to Build Your Portfolio
The projects below are arranged from the easiest to the more advanced, so you can build your skills step by step.
Foundation Projects
1. Perform Exploratory Data Analysis on a Public Survey Dataset
Exploratory Data Analysis (EDA) is one of the first skills every aspiring data scientist should learn. This project has you analyze a public survey dataset to identify patterns, trends, and relationships using basic statistical techniques and visualizations. Rather than building machine learning models, the focus is on understanding the data and communicating meaningful insights.
Recommended dataset: Stack Overflow Developer Survey 2025
Tools & Libraries:
- Python
- Pandas
- Matplotlib
- Seaborn
- Jupyter Notebook
Skills you’ll learn:
- Importing and exploring datasets
- Descriptive statistics
- Identifying missing values
- Creating charts and graphs
- Drawing conclusions from data
Estimated time: 2-4 hours
Example source code: Explore this EDA project on GitHub to understand how the analysis is structured.
2. Clean and Analyze a Messy CSV Dataset
Real-world datasets are rarely perfect. Missing values, duplicate records, inconsistent formatting, and incorrect data types are common challenges that data professionals deal with every day. This project teaches you how to clean raw data before performing meaningful analysis.
You’ll import a messy CSV file, identify common data quality issues, clean the dataset, and prepare it for analysis. Understanding data cleaning is essential because machine learning models are only as good as the data they’re trained on.
Recommended dataset: Messy Employee Dataset (Kaggle)
Tools & Libraries:
- Python
- Pandas
- NumPy
- Jupyter Notebook
Skills you’ll learn:
- Handling missing values
- Removing duplicates
- Data transformation
- Working with different data types
- Preparing datasets for analysis
Estimated time: 3-5 hours
Example source code: Explore this employee data cleaning project on GitHub to see how missing values, duplicates, inconsistent formatting, and invalid entries can be cleaned using Pandas and NumPy.
3. Create Data Visualization from a Real Dataset
Data visualization helps transform raw numbers into meaningful stories. Here, you’ll create charts and dashboards that explain trends using a real-world dataset such as COVID-19 statistics, global population data, or climate data.
Instead of creating random graphs, focus on answering a specific question. For example, “How has the population changed over the last 20 years?” or “Which countries recorded the highest vaccination rates?” This approach helps you develop analytical thinking alongside visualization skills.
Recommended dataset: Our World in Data – CO₂ and Greenhouse Gas Emissions
Tools & Libraries:
- Python
- Pandas
- Matplotlib
- Seaborn
- Plotly (optional)
Skills you’ll learn:
- Choosing the right chart type
- Data storytelling
- Visual communication
- Identifying trends and outliers
- Presenting insights clearly
Estimated time: 3-5 hours
Example source code: Explore this CO₂ Global Emissions Analysis project on GitHub to see how a real-world dataset can be cleaned, analyzed, and transformed into meaningful visualizations.
Beginner machine-learning projects
1. Build a House Price Prediction Model with Linear Regression
Linear regression is often the first machine learning algorithm beginners learn because it is easy to understand and forms the foundation for many predictive models. You’ll build a simple linear regression model to predict house prices using features such as living area, the number of bedrooms, and other property characteristics.
The goal is not to build a perfect prediction model but to understand how machine learning uses historical data to identify relationships between variables and make predictions. Along the way, you’ll learn how to prepare data, train a model, evaluate its performance, and interpret the results.
Recommended dataset: House Prices: Advanced Regression Techniques (Kaggle)
Tools & Libraries:
- Python
- Pandas
- NumPy
- Scikit-learn
- Matplotlib
- Jupyter Notebook
Skills you’ll learn:
- Preparing data for machine learning
- Feature selection
- Training a linear regression model
- Evaluating model performance using MAE, MSE, R²
- Interpreting prediction results
Estimated time: 5-8 hours
Example source code: Explore this house price prediction project on GitHub to learn how a simple linear regression model is built, trained, and evaluated using Scikit-learn.
2. Build a Titanic Survival Prediction Model
Classification is one of the most common machine learning tasks, and the Titanic dataset is one of the best places to start. Using this Titanic dataset, you’ll build a logistic regression model that predicts whether a passenger survived using passenger information such as age, gender, ticket class, fare, and family size.
Rather than focusing only on building a model, you’ll learn the complete machine learning workflow, including data processing, feature selection, model training, prediction, and evaluation. This project introduces binary classification and helps you understand how machine learning can solve real-world decision-making problems.
Recommended dataset: Titanic: Machine Learning from Disaster (Kaggle)
Tools & Libraries:
- Python
- Pandas
- NumPy
- Scikit-learn
- Matplotlib
- Seaborn
- Jupyter Notebook
Skills you’ll learn:
- Preparing data for classification
- Handling missing values and categorical variables
- Building a logistic regression model
- Evaluating model performance using accuracy, precision, recall, and confusion matrix
- Interpreting classification results
Estimated time: 5-8 hours
Example source code: Explore this Titanic survival prediction project on GitHub to learn how a logistic regression model is trained and evaluated.
3. Perform Customer Segmentation with K-Means Clustering
Customer segmentation is one of the most common applications of unsupervised machine learning. In this project, you’ll group customers into different segments based on characteristics such as annual income, spending habits, or purchasing behavior. Instead of predicting an outcome, clustering helps identify patterns that aren’t immediately obvious in the data.
The project introduces K-Means clustering, a popular algorithm used by businesses to understand customer groups and create targeted marketing strategies. By the end of the project, you’ll know how to prepare data, choose the right number of clusters, visualize customer segments, and interpret the results.
Recommended dataset: Mall Customer Segmentation Dataset (Kaggle)
Tools & Libraries:
- Python
- Pandas
- NumPy
- Scikit-learn
- Matplotlib
- Seaborn
- Jupyter Notebook
Skills you’ll learn:
- Understanding unsupervised learning
- Preparing data for clustering
- Building a K-Means clustering model
- Determining the optimal number of clusters using the Elbow Method
- Visualizing and interpreting customer segments
Estimated time: 6-8 hours
Example source code: Explore this customer segmentation project on GitHub to see how K-Means clustering is used to identify customer groups from real-world data.
Guided Stretch Projects
1. Build a Sentiment Analysis Model
Sentiment analysis is a Natural Language Processing (NLP) task that identifies whether a piece of text expresses a positive or negative sentiment. You’ll analyze tweets to understand public opinion about a product, service, or topic.
This project introduces text preprocessing and basic NLP techniques while showing how machine learning can work with written language instead of numerical data. You’ll learn how to clean text, convert it into machine-readable features, train a classification model, and evaluate its performance.
Recommended dataset: Sentiment140 Dataset (Kaggle)
Tools & Libraries:
- Python
- Pandas
- NLTK
- Scikit-learn
- Matplotlib
- Jupyter Notebook
Skills you’ll learn:
- Cleaning and preprocessing text data
- Tokenization and stop-word removal
- Converting text into numerical features using TF-IDF vectorization
- Building a sentiment classification model
- Evaluating classification performance
Estimated time: 6-10 hours
Example source code: Explore this sentiment analysis project on GitHub to learn how text data is prepared and used to classify tweets.
2. Forecast Future Sales Using Time-Series Analysis
Time-series forecasting helps businesses predict future trends based on historical data. You’ll analyze past sales records to forecast future sales and identify seasonal patterns or long-term trends. Time-series analysis is widely used in retail, finance, manufacturing, and supply chain management to support planning and decision-making.
Rather than treating each data point independently, you’ll learn how chronological data behaves over time. You’ll clean and prepare date-based data, visualize sales trends, build a basic forecasting model, and evaluate how well your predictions match actual values.
Recommended dataset: Store Sales – Time Series Forecasting (Kaggle)
Tools & Libraries:
- Python
- Pandas
- NumPy
- Matplotlib
- Scikit-learn
- Statsmodels or Prophet Jupyter Notebook
Skills you’ll learn:
- Preparing and working with time-series data
- Identifying trends and seasonality
- Building a basic forecasting model
- Visualizing historical and predicted sales
- Evaluating forecasting accuracy
Estimated time: 6-10 hours
Example source code: Explore this time-series forecasting project on GitHub to learn how historical sales data is analyzed and used to predict future trends.
3. Build and Share a Simple Dashboard
Creating charts is only part of data analysis. Businesses often need interactive dashboards that bring multiple visualizations together in one place so decision-makers can monitor trends and performance. You’ll build a simple dashboard using a real dataset and display key metrics, charts, and filters in an easy-to-understand format.
Rather than analyzing a single chart, you’ll learn how to present insights that help users explore data and answer questions on their own. Building a dashboard is also an excellent portfolio project because it demonstrates both your analytical thinking and your ability to communicate data effectively.
After completing your dashboard, publish it using Streamlit Community Cloud or share it through GitHub so employers can interact with your work.
Recommended dataset: Superstore Sales Dataset (Kaggle)
Tools & Libraries:
- Python
- Pandas
- Plotly
- Streamlit or Power BI
- Jupyter Notebook (for data preparation)
Skills you’ll learn:
- Preparing data for dashboards
- Designing effective visualizations
- Building interactive charts and filters
- Presenting KPIs and business insights
- Sharing dashboards with others
Estimated time: 5-7 hours
Example source code: Explore this dashboard project on GitHub to see how multiple charts and KPIs are combined into an interactive dashboard.
4. Deploy a Data Science Project with Streamlit
Completing a project is only half the journey. To impress recruiters and hiring managers, you should also make your work accessible online. In this project, you’ll use Streamlit to turn one of your completed data science projects into a simple web application that anyone can access through a browser.
Whether it’s a house price predictor, customer segmentation tool, sentiment analysis app, or sales dashboard, deploying your project demonstrates that you can build solutions that others can use. It also strengthens your portfolio by giving employers a live project to explore instead of just reviewing screenshots or source code.
Recommended dataset: Reuse one of the datasets from the previous projects, such as the House Prices, Titanic, Customer Segmentation, or Store Sales dataset.
Tools & Libraries:
- Python
- Streamlit
- Pandas
- Scikit-learn (if using a machine learning model)
- GitHub
Skills you’ll learn:
- Building a simple Streamlit application
- Displaying charts, tables, and model predictions
- Deploying a project online
- Sharing live project links with recruiters
- Improving your professional portfolio
Estimated time: 4-6 hours
Example source code: Explore this Streamlit project on GitHub to learn how a data science project is converted into an interactive web application.
Turning These Projects into a Portfolio
Completing projects is important, but presenting them professionally is what helps you stand out during internships and job applications. Well-organized data science portfolio projects demonstrate your technical skills, problem-solving ability, and commitment to continuous learning, even if you have little or no professional experience.
Turning These Projects into a Portfolio
Completing projects is important, but presenting them professionally is what helps you stand out during internships and job applications. Well-organized data science portfolio projects demonstrate your technical skills, problem-solving ability, and commitment to continuous learning, even if you have little or no professional experience.
Publish Your Projects on GitHub
Create a GitHub account and upload each project to a separate repository. Organize your code, datasets (where licensing allows), notebooks, and supporting files so employers can easily review your work.
Make sure each repository includes:
- A clear project title and description
- Installation and setup instructions
- Dataset source and attribution
- Key findings or results
- Screenshots or sample outputs
- A list of tools and libraries used
Write a Strong README File
A well-written README helps recruiters quickly understand your project without reading every line of code. Explain the problem you’re solving, the dataset you used, your approach, the technologies involved, and the final outcome.
Keep the language simple and focus on what you learned as well as what the project achieves.
Showcase Your Work on LinkedIn
Share your completed projects on LinkedIn to increase your visibility with recruiters and hiring managers. Include a short description of the project, the skills you used, and a link to your GitHub repository or live Streamlit application.
As your portfolio grows, it becomes strong evidence of your practical abilities. Even without professional experience, a collection of well-documented projects can demonstrate that you’re ready to take on internships, freelance work, or entry-level data science roles.
Common Mistakes Beginners Make with Data Science Projects
Building projects is one of the fastest ways to learn data science, but many beginners slow their progress by making avoidable mistakes. Recognizing these common challenges early can help you build stronger projects and develop practical skills more efficiently.
Starting with Projects That Are Too Advanced
Many beginners jump straight into complex projects involving deep learning or large language models before mastering the fundamentals. Start with projects that teach core concepts such as data cleaning, visualization, regression, and classification before moving on to more advanced topics.
Skipping Documentation
A project without documentation is difficult for others to understand. Recruiters often spend only a few minutes reviewing a portfolio, so every project should include a clear README explaining the problem, dataset, approach, tools used, and key findings.
Leaving Projects Unfinished
It’s better to complete five simple, polished projects than to start ten ambitious ones and finish none. Completing a project teaches you the full workflow, from collecting data to presenting results, and demonstrates consistency to employers.
Copying Tutorials Without Understanding Them
Following tutorials is a great way to learn, but simply copying code won’t build real problem-solving skills. After completing a tutorial, try modifying the project, using a different dataset, adding new features, or explaining the code in your own words. This helps you understand the concepts and creates a portfolio project that reflects your own abilities.
Avoiding these mistakes will help you build projects that not only strengthen your technical skills but also make a stronger impression on recruiters and hiring managers.
Conclusion
The best way to learn data science is by building projects that apply what you’ve learned. Start with simple projects, complete them one at a time, and document your work clearly. As your skills grow, you’ll build a portfolio that demonstrates your ability to solve real-world problems and makes you more competitive for internships and entry-level roles.
If you’re looking for structured guidance, hands-on projects, and industry mentorship, explore AITC Education’s Data Science Training in Nepal. The course is designed to help beginners develop practical skills, complete portfolio-ready projects, and prepare for a career in data science.
Frequently Asked Questions
Do I need to know Python before starting these projects?
Basic Python knowledge is helpful, but you don’t need to master it before getting started. Many beginners learn Python while working on their first data science projects, making it easier to understand concepts through hands-on practice.
How long does each data science project take?
Most beginner projects take 2 to 10 hours to complete, depending on their complexity and your experience level. It’s perfectly fine to complete them over several days as you learn new concepts.
Where can I find free datasets for practice?
You can download free datasets from platforms such as Kaggle, the UCI Machine Learning Repository, Our World In Data, and data.gov. These sources provide high-quality datasets for beginners across a wide range of topics.
Do I need to pay for any tools or software?
No. Most beginner projects can be completed using free tools such as Python, Jupyter Notebook, VS Code, GitHub, StreamLit, and open-source libraries like Pandas, Scikit-learn, and Matplotlib.
How many projects do I need for a job-ready portfolio?
There is no fixed number. Three to five polished projects that show different skills are usually more useful than ten unfinished or repetitive projects.
What should I do after finishing these beginner projects?
Move on to more advanced projects, participate in Kaggle competitions, contribute to open-source projects, and continue improving your portfolio. Building increasingly complex projects will help you prepare for internships and entry-level data science roles.